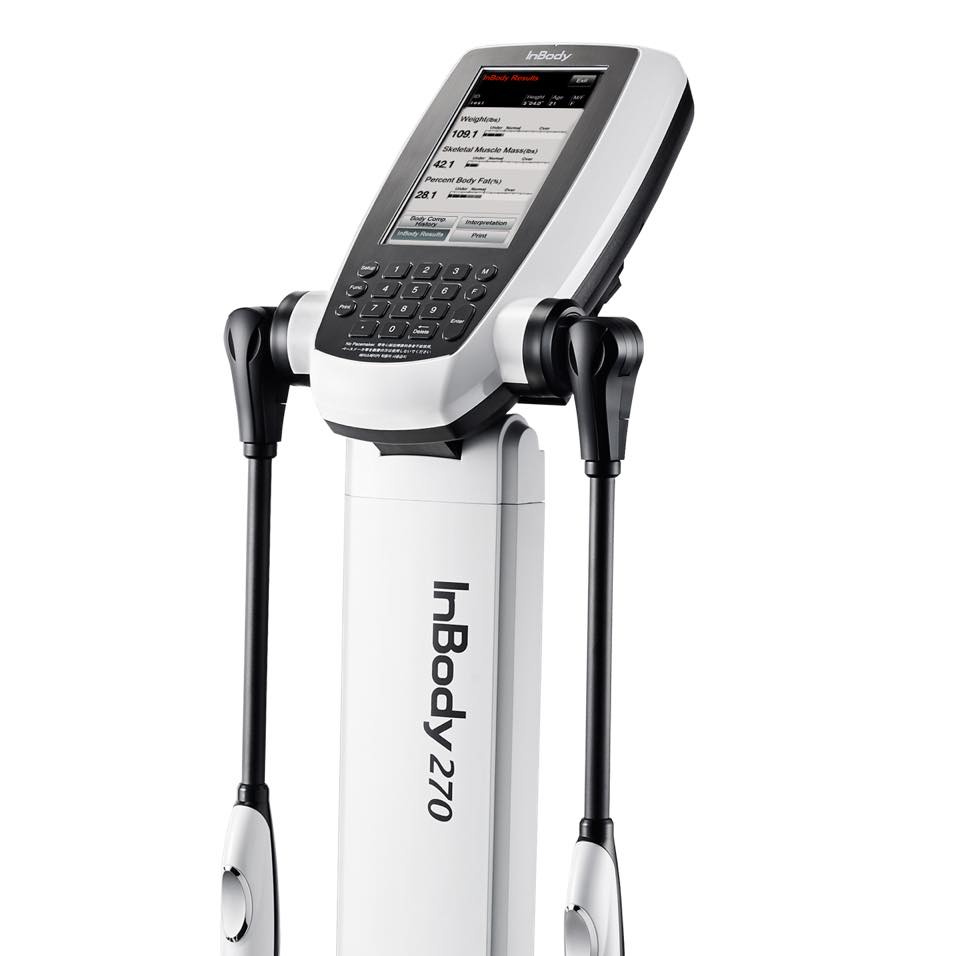
 So you got got on the Inbody and now have this piece of paper with all of these numbers and words, but what does it all mean? How can you apply this knowledge to your nutrition and body composition goals? I’ll go through each section one-by-one to better explain what they mean and how you can apply specific goals to improve your body composition.
Grab your InBody sheet and follow along in the sections below. Or, if you want to cut to the chase and find out which numbers you really need to concentrate on, scroll down to the end of this post.
Body Composition Analysis
- Total Body Water – This is the total amount of water in your body (water held inside and outside of your cells).
- Dry Lean Mass – This is the weight of protein within your body for building muscle. If this number is increasing, it is a good indicator that you are truly gaining muscle mass.
- Body Fat Mass – This is the weight of the fat within your body, including surface and internal (visceral) fat.
- Weight – This is your total body weight and the sum of all of the numbers above.
Muscle-Fat Analysis
This section reflects your overall body composition. The 100% mark at the top is based on what is considered the healthy ideal for an individual according to the WHO (World Health Organization) for your age, gender and height. For this section, you will want to compare bar lengths. We will get into ideal “shapes” and bar lengths once we explain what each item means:
- Weight – Total Body Weight (in pounds) as compared to the ideal individual of your same age, height and gender. For muscular individuals, this number can be higher than the “ideal” but is in fact a healthy weight.
- Skeletal Muscle Mass (SMM) – Total weight (in pounds) of your skeletal muscle (the muscles that can be grown and developed through exercise) compared to the ideal person of your age, height and gender. An increase in SMM would mean you have gained actual muscle, while a loss in SMM would indicate muscle loss.
- Body Fat Mass – This is how much body fat (in pounds) you have compared to an average person of your age, height and gender.
Now, let’s talk about the length of the bars and the target ranges (85 – 115). For example, if your weight bar extends to 115%, this would mean that your weight is 15% above the ideal for your age, gender and height. The same goes for skeletal muscle mass and body fat mass.
You will also notice that the ends of the bar lengths for weight, skeletal muscle mass and body fat mass make a certain shape, or either closely line up. Below are what these shapes mean:
- A “C” shape (where weight and body fat mass are higher than skeletal muscle mass) is characteristic of someone who is overweight, but you may also find this in someone who is normal or underweight as well. If body fat mass and skeletal muscle mass are too far off (with SMM being lower), despite weight being normal, this falls into the category of what most people call “skinny fat.” If your graph has a “C” shape, it would be a good idea to reduce body fat (therefore, also lowering body weight) while simultaneously increasing skeletal muscle mass. You can think of the “C” as standing for CHANGE needed.
- Conversely, a “D” shape (with skeletal muscle mass being higher than weight and body fat mass) indicates an “athletic” body type. This is the ideal body composition shape. If you fall into this category, you may want to increase strength and size while monitoring your body fat. Or, you may want to improve leanness and work on reducing body fat. If you go this route, you will want to make sure you are not losing too much skeletal muscle mass in the process. You can think of “D” as standing for DYNAMITE.
- Lastly, if your graph reflects an “I” shape (where your weight, SMM and BFM are roughly in a straight line) you have a balanced body composition. While balance is good, it can still be improved. As we discussed above, a “D” shape is ideal. To get to a “D” shape you will seek to gain muscle or lose body fat to improve overall leanness, and therefore increasing SMM above weight and body fat mass. You can think of an “I” shape as straight up and down, devoid of mass. Those that have an “I” shape should use this as a launching pad from which you should add muscle to become the desired “D” shape.
Obesity Analysis
This section is similar to the Muscle-Fat Analysis in that there are target ranges and you will see how you compare to the “normal” range for your gender and height.
- Body Mass Index (BMI) is a measure of obesity used in many medical offices and the military. The problem with BMI is that it does not account for body composition and therefore, is not a good indicator of obesity. For example, muscular athletes can have a BMI above 30, but are clearly not obese. This measurement is included only for comparison to the PBF measurement below, which is a much better indicator of body composition.
- Percent Body Fat (PBF) is simply body fat mass divided by your total body weight. It tells you how much of your body is made up of fat, which puts your weight into context. A healthy range for men is 10-20% while a healthy range for females is 18-28%, as women tend to carry more fat. High body fat percentages and low muscle mass lead to increased risk for health problems.
Segmental Lean Analysis
This section shows how much Lean Body Mass (LBM) is contained in each segment of your body (not how much muscle). Lean Body Mass includes the weight of all of your organs, muscle, and water. This section reflects weight in pounds as well as lean body mass percentages against the average expected amount of lean body mass for your height and weight.
The percentage shows whether or not you have enough LBM to support your own body weight. You should seek to have this number at 100% or higher. If you have a body part or “segment” less than 100%, you should target exercises to increase LBM in these particular areas to achieve a more balanced body composition. If you fall under 100% in any area, you are at risk for injury due to the low amount of lean body mass. You may find differences in top half vs. bottom half, or even right and left. Muscle imbalances between right and left arms and/or legs may be due to an injury or overdevelopment on one side.
Body Composition History
Here you will find a history of your results, by date, for Weight, Skeletal Muscle Mass and Percentage Body Fat.
Body Fat – Lean Body Mass Control
This section helps shed light on how to reach an “ideal” body composition (defined as the average Percentage Body Fat for your gender – 15% for men and 23% for women). It provides recommended changes (gaining or losing) for Lean Body Mass and Body Fat Mass. Note, even if there is no recommendation to add Lean Body Mass, rarely is there a person that cannot afford to gain more muscle.
Lean Body Mass
This is the combination of water weight and dry lean mass to the left on your InBody results sheet. This is the weight of everything in your body that is not considered Body Fat (muscle, water, bones, organs, etc.).
Basal Metabolic Rate
This is the amount of calories your body needs each day to perform its basic, life-sustaining functions (breathing, digestion, pumping blood, brain activity, etc.). The amount of calories you should be eating each day are increased depending on your activity level. This is called Total Daily Energy Expenditure (TDEE).
For example, if you are doing CrossFit 3-5 days per week, you will need to multiply your BMR x 1.55 (approximately) to find your Total Daily Energy Expenditure (TDEE). If you are doing CrossFit 6-7 days per week, you need to multiply your BMR x 1.725 (approximately) to find your TDEE. Your TDEE is the amount of calories you should be eating each day to MAINTAIN your current weight. There are many calculators on the Internet to help determine your TDEE (which will be your maintenance calories). www.tdeecalculator.net is a good place to start.
Cut to the Chase
I understand this is a lot of information. Instead of analyzing every result above, let’s focus on what’s most important. To improve your body composition, you should really concentrate on Skeletal Muscle Mass, Percentage Body Fat and Muscle-Fat Analysis (more specifically, the shape your bars make).
-
Skeletal Muscle Mass (SMM) is important because this is what you can grow through exercise. Increasing this number means you are increasing actual muscle. You will want to try and increase SMM without a significant increase in body fat.
-
As for the Muscle-Fat Analysis, you will notice that your bar lengths make a shape, either “C” “D” or “I”. You should seek to have your bar lengths make a “D” shape (with SMM bar extending beyond weight and body fat bars). This indicates the ideal “athletic” body type.
-
Lastly, you should focus on Percentage Body Fat as this tells you how much fat you have within your body. A healthy range for men is 10-20% while a healthy range for females is 18-28%. If your body fat is higher than the ideal range for your gender, this puts you at greater risk for health problems.
-
At the end of the day, you should focus on increasing skeletal muscle mass while limiting the addition of body fat. This will lead you to the ideal “D” shape under the Muscle-Fat Analysis.
Your InBody results can be a wonderful tool and a great way to keep up with your progress. However, please remember that these are just numbers; use them as a baseline to track changes in body composition.
As these are just numbers, another great way to keep up with your progress is to take regular pictures. Don’t get hung up on numbers; rather, use this information to focus your nutrition and training to achieve desired changes. Remember, this is all about becoming a better version of you, and you should always be a work in progress.
WRITTEN BY: Janna Davis
9/21/2017